Skills & techniques: Data analysis, supervised machine learning techniques, Python, Tableau.
Overall Summary
Collisions between motor vehicles and large vertebrates are a severe problem in the state of New York and other states across the country. Specifically, deer-vehicle collisions are the most common accident among these types. Approximately 1.5 million collisions occur every year. The consequences are 1.3 million dead deer, 29,000 human injuries, 200 human fatalities, and one billion dollars in property damage nationwide.
The objective of this study is to predict the occurrence of a deer-vehicle collision in the state of New York based on the deer-vehicle collision data from the NY Department of transportation. The model will predict whether a crash against a deer is more likely to occur using predictors such as weather conditions, light conditions, road surface, road characteristics, and the month of the year.
Ultimately, the information will be shared with the New York State Department of Transportation to determine if there are additional mitigation steps to be taken to prevent accidents of this nature. In the future, similar models can be developed for applications in Artificial Intelligence that can prevent accidents altogether.
Methodology: Since the data contains only accidents (positive samples), negative samples have been generated based on the parameters of the positive ones. Additionally, the number of negative samples is three times the number of positive ones since the accident is rare. The negative samples were generated with Mockaroo.
Models: The target variable is categorical, so logistic regression, k-Nearest Neighbors, classification trees, and random forests were evaluated
Results: Decision trees and random forests performed better than their counterparts. The reason could be because of the nature of that data, and decision trees are very good at capturing non-linear relationships.
Full report
Collisions between motor vehicles and large vertebrates pose a significant threat in the state of New York and other states across the country, resulting from the increasing anthropogenic transformation of the landscape. According to experts, nearly 50% of the land area in the United States is within 300 meters of a road, indicating that animals’ proximity to roads is minimal (Bisonnette & Rosa, 2012). Despite this, the population of Odocoileus sp. has increased significantly due to wildlife management practices and changes in habitat structure (Gonser et al., 2009).
Although several species can cause these collisions, Odocoileus spp. is responsible for most of them, resulting in ecological damage, economic loss, and injuries (Bisonette et al., 2008). On average, 1.5 million collisions between motor vehicles and deer occur annually in the United States, causing numerous fatalities, injuries, and property damage worth over a billion dollars (Mastro et al., 2008). In New York State alone, nearly 600,000 collisions between motor vehicles and deer have been recorded since 2007. Various strategies, such as deer fencing, sex distribution among deer, miles of roadway, and reflectors, have been employed to mitigate the problem, but their impact has been limited (Gonser et al., 2009; Reeve et al., 1993).
Several factors increase the likelihood of deer-vehicle collisions, including poor lighting conditions, weather, and road surface conditions (Mastro et al., 2008). Most accidents occur during low light conditions, with 80-95% happening between sunset and sunrise, which diminishes the driver’s visibility and reaction time (Mastro et al., 2008). Studies suggest that clear weather conditions increase the likelihood of an accident occurring (Mastro et al., 2008), and the speed limit also plays a critical role since it increases the time to stop the vehicle.
Therefore, the objective of this study is to predict the occurrence of deer-vehicle collisions based on various weather, light, and road surface conditions using machine learning models. Ultimately, the purpose is to raise awareness among the population of New York State about the causes of these accidents and inform them of the risks associated with driving in areas with a high probability of deer-vehicle collisions.


Literature Review
As an eminent cause of accidents in the nation, particularly in rural regions, numerous examinations have been conducted to analyze Deer-Vehicle collisions. These investigations have covered a broad scope of topics, from prognosticating the event to diverse strategies to avoid it (Ujvari et al. 1998). Several studies, for example, Bisonnete & Kassar’s (2008), have scrutinized the plausible hotspots of these collisions to clarify their occurrence and, potentially, to prevent them. In the same vein, Boyce et al. (2011) devised a model to prognosticate collisions in Edmonton, Canada, based on several features such as the speed limit, forest vegetation, landscape heterogeneity, and distance to water. Similarly, we endeavor to prognosticate the likelihood of these incidents occurring in New York State by utilizing a classification model.
This case study aims to prognosticate the possibility of a collision with a deer based on various predictors, including light conditions, weather, road characteristics, and road surface. The dataset solely contains positive samples (i.e., accidents that did occur). Nonetheless, to construct a proper classification model, the dataset must also incorporate negative samples (i.e., non-accidents). These negative samples can be generated via a methodology proposed by Yuan et al. (2007). Using the positive samples from the current dataset, it is possible to randomly change one of the following features of an observation to create a negative one:
• Hour: Choosing a random time between 00:00 and 23:59, except for the time recorded in the dataset. Altering the hour feature might affect other time-related features, such as light conditions.
• Day: Choosing a random day between 1 and 365, except for the day recorded in the dataset. Modifying the day feature will affect features related to the day, including weather and time-related features.
• Road Segment: Selecting a random segment of the road, except for the segment recorded in the dataset.
Exploratory Data Analysis
Data shape


Data description


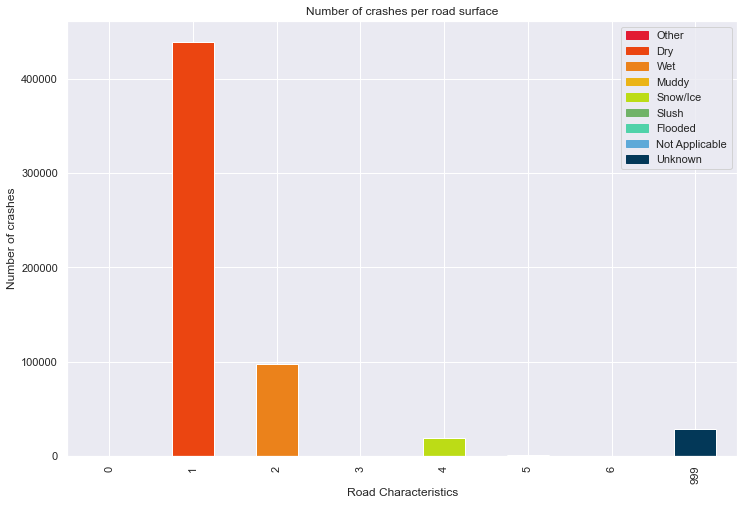

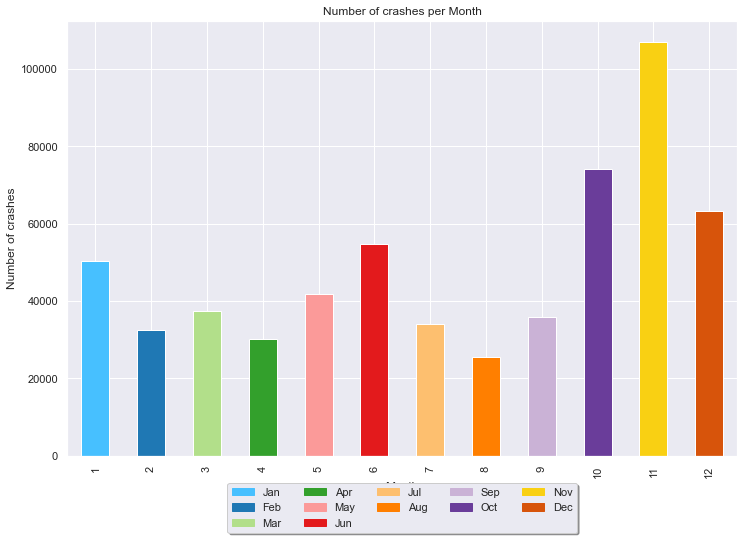

Figure 2. Behaviour of the categorical predictors of the dataset. 1. Number of accidents per year 2. Number of accidents per weather conditions 3. Number of accidents per light conditions 4.. Number of accidents per road characteristics 5. Number of accidents per road surface 6. Number of accidents per month
Data clean
The data cleaning process started by eliminating unnecessary features like collision type since all the observations belonged to the deer-vehicle collision type. Additionally, we deleted the UTM fields due to the impossibility of converting the values to latitude and longitude. Finally, we deleted the features related to the number of injured and the number of severely injured because it makes no sense to include features that are consequences of accidents if we are predicting the occurrence of an accident.
Data Split


Results
- The logistic regression model applied to the dataset yielded very good results, the model obtained 93% accuracy.
- KNN is a data-driven method. The model obtained 96% accuracy.
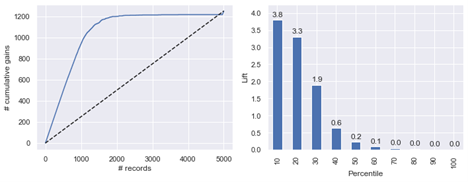
- The classification tree had the best results with an accuracy of 98%.
- In a similar way, the random forest outperformed KNN and Logistic Regression with a 99% in accuracy.
- In a similar way, the gradient boosting yielded similar results to the random forest with an accuracy of 98%,


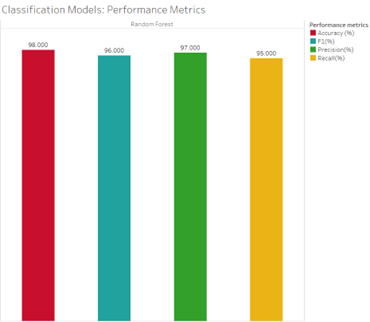


Performance of A. Logistic Regression B. KNN C. Classification Tree. D. Random Forest E. Grading Boosting
Conclusion
All the models performed very well because they obtained accuracies of 90% or higher. Since the data was purposely imbalanced due to the nature of traffic accidents, we expected some of the models to perform better. For this reason, we evaluated precision, recall, and F1 score. KNN has a recall of 29%, which means that the model is classifying many accidents as non-accidents (Japkowicz, 2006). Decision trees and random forests performed better than their counterparts. The reason could be because of the nature of that data, and decision trees are very good at capturing non-linear relationships. In conclusion, the Decision Trees and Random Forests performed better.
References
Bissonette, J. A., Kassar, C. A., & Cook, L. J. (2008). Assessment of costs associated with deer–vehicle collisions: human death and injury, vehicle damage, and deer loss. Human-Wildlife Conflicts, 2(1), 17-27.
Bissonette, J. A., & Rosa, S. (2012). An evaluation of a mitigation strategy for deer‐vehicle collisions. Wildlife Biology, 18(4), 414-423.
Gonser, R. A., Jensen, R. R., & Wolf, S. E. (2009). The spatial ecology of deer–vehicle collisions. Applied Geography, 29(4), 527-532.
Japkowicz, N. (2006, July). Why question machine learning evaluation methods. In AAAI workshop on evaluation methods for machine learning (pp. 6-11).
Mastro, L. L., Conover, M. R., & Frey, S. N. (2008). Deer–vehicle collision prevention techniques. Human-Wildlife Conflicts, 2(1), 80-92.
Parra, C. A., Duarte, A., Luna, R. S., Wolcott, D. M., & Weckerly, F. W. (2014). Body mass, age, and reproductive influences on liver mass of white-tailed deer (Odocoileus virginianus). Canadian Journal of Zoology, 92(4), 273-278.
Reeve, Archie F., and Stanley H. Anderson. “Ineffectiveness of Swareflex reflectors at reducing deer-vehicle collisions.” Wildlife Society Bulletin (1973-2006) 21.2 (1993): 127-132.
Ujvari, M., Baagøe, H. J., & Madsen, A. B. (1998). Effectiveness of wildlife warning reflectors in reducing deer-vehicle collisions: a behavioral study. The Journal of wildlife management, 1094-1099.
Yuan, Z., Zhou, X., Yang, T., Tamerius, J., & Mantilla, R. (2017, August). Predicting traffic accidents through heterogeneous urban data: A case study. In Proceedings of the 6th international workshop on urban computing (UrbComp 2017), Halifax, NS, Canada (Vol. 14, p. 10).
Appendix
